You are here: GSI Wiki>TOS/Timing Web>TimingSystemDocumentation>TimingSystemDocuments>TimingSystemDocumentsReportsAndMeasurements>SaftlibEtherboneLm32LatencyMeasurement (2017-11-30, mreese)
MSI/IRQ Latency Measurements with LM32, Etherbone and Saftlib
In autumn 2017, the latency of Message Signalled Interrupts (MSI) has been measured involving different layers of the timing receiver stack. The results are presented here.Question
How much time does it take for interrupts to go through different layers of the Timing receiver stack?Measurements
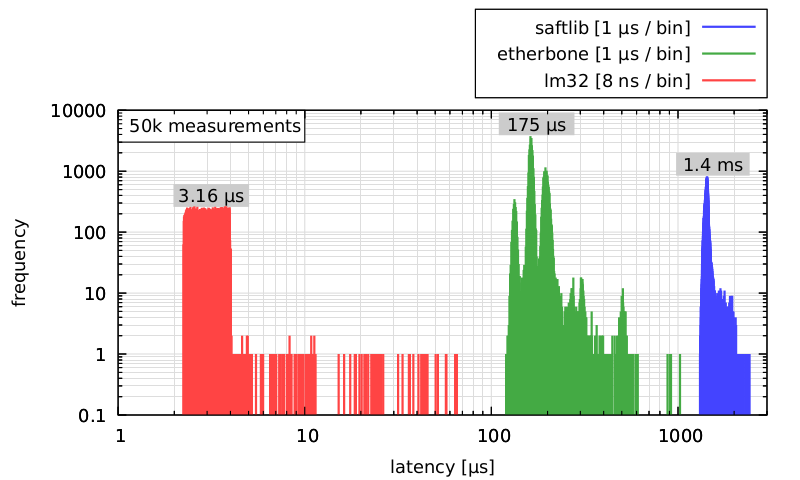
Numbers written on top of the distributions are mean values.
Saftlib (D-Bus + etherbone)
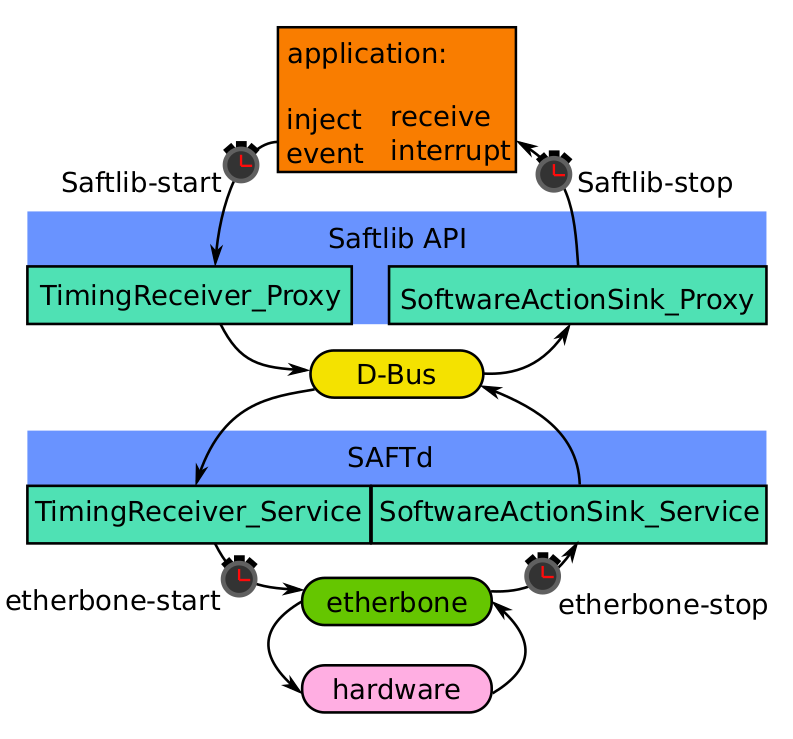
The travel time of an interrupt from the real-time hardware into the Linux user space is approximated by measuring the round trip time of a signal and interpreting this as two times the interrupt latency (i.e. interrupt latency = 0.5 * round trip time ). A measurement is started when a timing event is injected into the ECA via saftlib (Saftlib-start). The event deadline is zero, which means immediate execution. The measurement is stopped when a Saftlib interrupt is received from a SoftwareActionSink that was triggered by the injected event (Saftlib-stop). This measurement gives an approximation of the interrupt latency in a Saftlib application, and the results are shown in the blue distribution in the figure above. The measurements have performed on a SCU 3 using the Cherry Release. A schematic diagram of the setup can be seen below.Etherbone
Additional time stamps are taken inside the (modified) TimingReceiver Saftlib driver code before the etherbone function calls (etherbone-start), and just after receiving an MSI interrupt in the SoftwareActionSink driver (etherbone-stop). This additional measurement gives an estimate of the interrupt latency in user space applications that use etherbone only (and no Saftlib, i.e. no D-Bus), and is shown as the green distribution in the green distribution in the figure above (again, latency = 0.5 * round trip time).
LM32
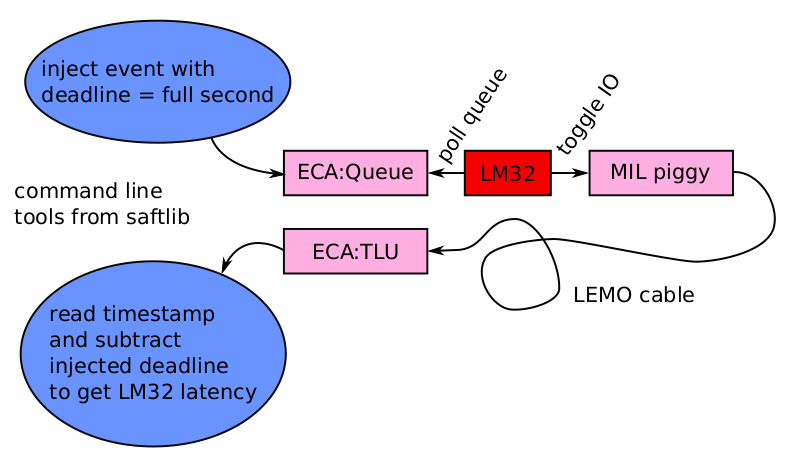
To measure the LM32 latency (how long it takes a timing event to affect a program running on an LM32 soft core processor), a different setup was used (see figure below) on an SCU3. Events with a known execution time were injected using saftlib command line tools. The ECA was configured to put these events into the ECA:Queue for the LM32 soft core processor. The LM32 was polling the queue and toggling an output which was fed into an input. The ECA:TLU was configured to create timing events on rising edges on this input, containing the timestamp of the rising edge. These events were read out using saftlib command line tools. The obtained timestamp of the rising edge was subtracted from the injected event execution time. The difference was interpreted as LM32 latency.
Older measurements
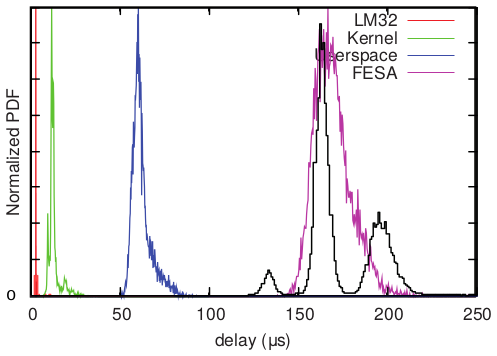
There is an older measurement from 2012 (see publication). The older measurement has been done prior to the introduction of MSI interrupts. In comparison, the Etherbone latency presented above compares to the FESA latency in the previous measurement. The following picture shows the previous measurements from 2012 (colors) in comparison to the most recent Etherbone latency measurement from 2017 (black). -- MichaelReese - 29 Nov 2017
 | I | Attachment | Action | Size | Date | Who | Comment |
|---|---|---|---|---|---|---|
| |
latency_measurement.pdf | manage | 20 K | 2017-11-29 - 15:20 | UnknownUser | latency measurements at different levels of the timing firmware/software stack |
| |
latency_measurement.png | manage | 39 K | 2017-11-29 - 15:20 | UnknownUser | latency measurements at different levels of the timing firmware/software stack |
| |
lm32_measurement_setup.pdf | manage | 10 K | 2017-11-29 - 14:55 | UnknownUser | setup for the LM32 latency measurement |
| |
lm32_measurement_setup.png | manage | 66 K | 2017-11-29 - 14:55 | UnknownUser | setup for the LM32 latency measurement |
| |
old_new_comparison.png | manage | 34 K | 2017-11-29 - 15:38 | UnknownUser | previous measurements (colors) in comparison to the most recent etherbone latency measurement (black) |
| |
saftlib_latency.cpp | manage | 3 K | 2017-11-29 - 15:27 | UnknownUser | the program to generate the blue distribution |
| |
userspace_measurement_setup.pdf | manage | 11 K | 2017-11-29 - 14:44 | UnknownUser | setup for the saftlib and etherbone measurement |
| |
userspace_measurement_setup.png | manage | 76 K | 2017-11-29 - 14:45 | UnknownUser | setup for the saftlib and etherbone measurement |
Please login to edit this topic
Topic revision: r5 - 2017-11-30, mreese
 Copyright © by the contributing authors. All material on this collaboration platform is the property of the contributing authors.
 Ideas, requests, problems regarding GSI Wiki? Send feedback | Legal notice | Privacy Policy (german)


