|
|
You are here: GSI Wiki>NustarDAQ Web>SEPMockupTests>SEPMockupGallery (2026-05-24, PhilippKlenze)
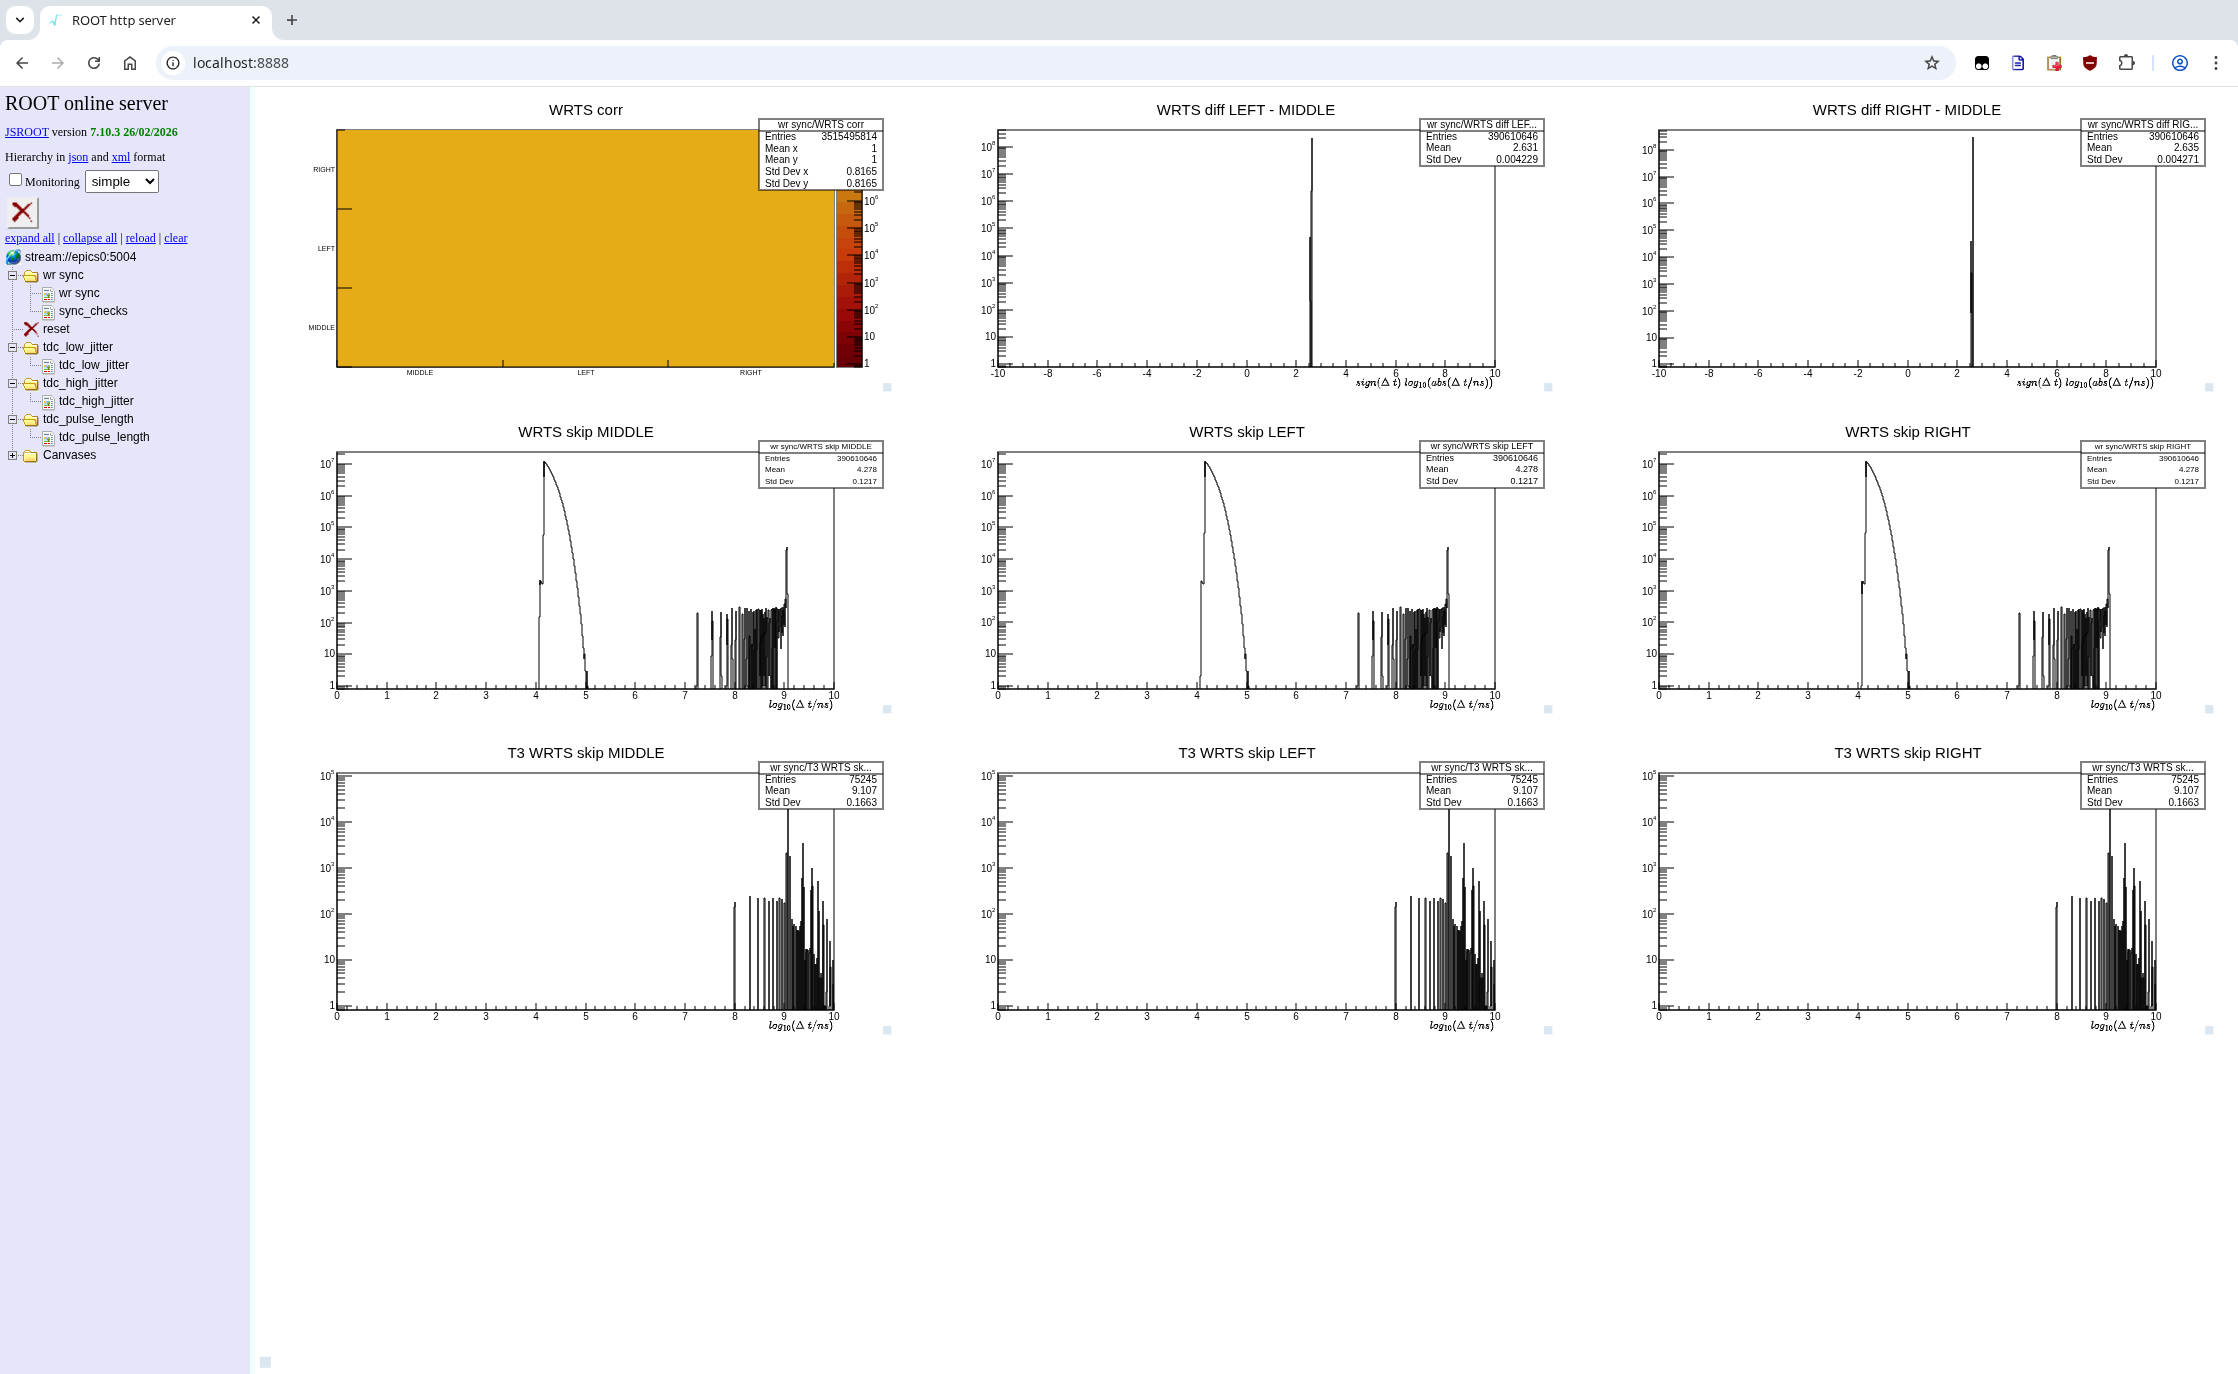
TDC histogram nomenclature:
VFTX locations are indicated with capital letters:
L[eft]
M[iddle]
R[ight]

The Vuloms which generate triggers are indicated with lower case letters:
l[eft]
m[iddle]
r[ight]

So m.T1 is the T1 generated by the middle VULOM (the MTL).

For signals between the nodes, there are three modes of transportation:
- LEMO (for reference only)
- DOFI
- HL (Highland)

Shared origins are prefixed.
L: m.T1 DOFI-LEMO means L.m.T1.DOFI - L.m.T1.LEMO,
and m.T1 LEMO L-M means L.m.T1.LEMO-M.m.T1.LEMO.
The following plots were about a day worth of data taken. m.T1 was generated from a 200kHz Poisson trigger (~51kHz accepted rate). The online analysis was not able to process data at that rate, so there are some gaps in the data. The pngs have been downscaled to fit on this screen, right-click, open in new tab to read any details. You can also check the live data from http://lxir123:8888 from within GSI (if we are running). WR overview diff: 2.63 corresponds to ~430ns. skip denotes the time difference between subsequent hits. No differences for the three nodes here. Deadtime is a bit more than 4 (e.g. 10 us), followed by the remainder of the Poisson distribution. The stuff beyond 1e7 ns is due to parts of the data being skipped. (TODO: detect data gaps (eventno?), do not plot differences.) For T3, the time distances are seem to be integer multiples of 100ms, as expected.
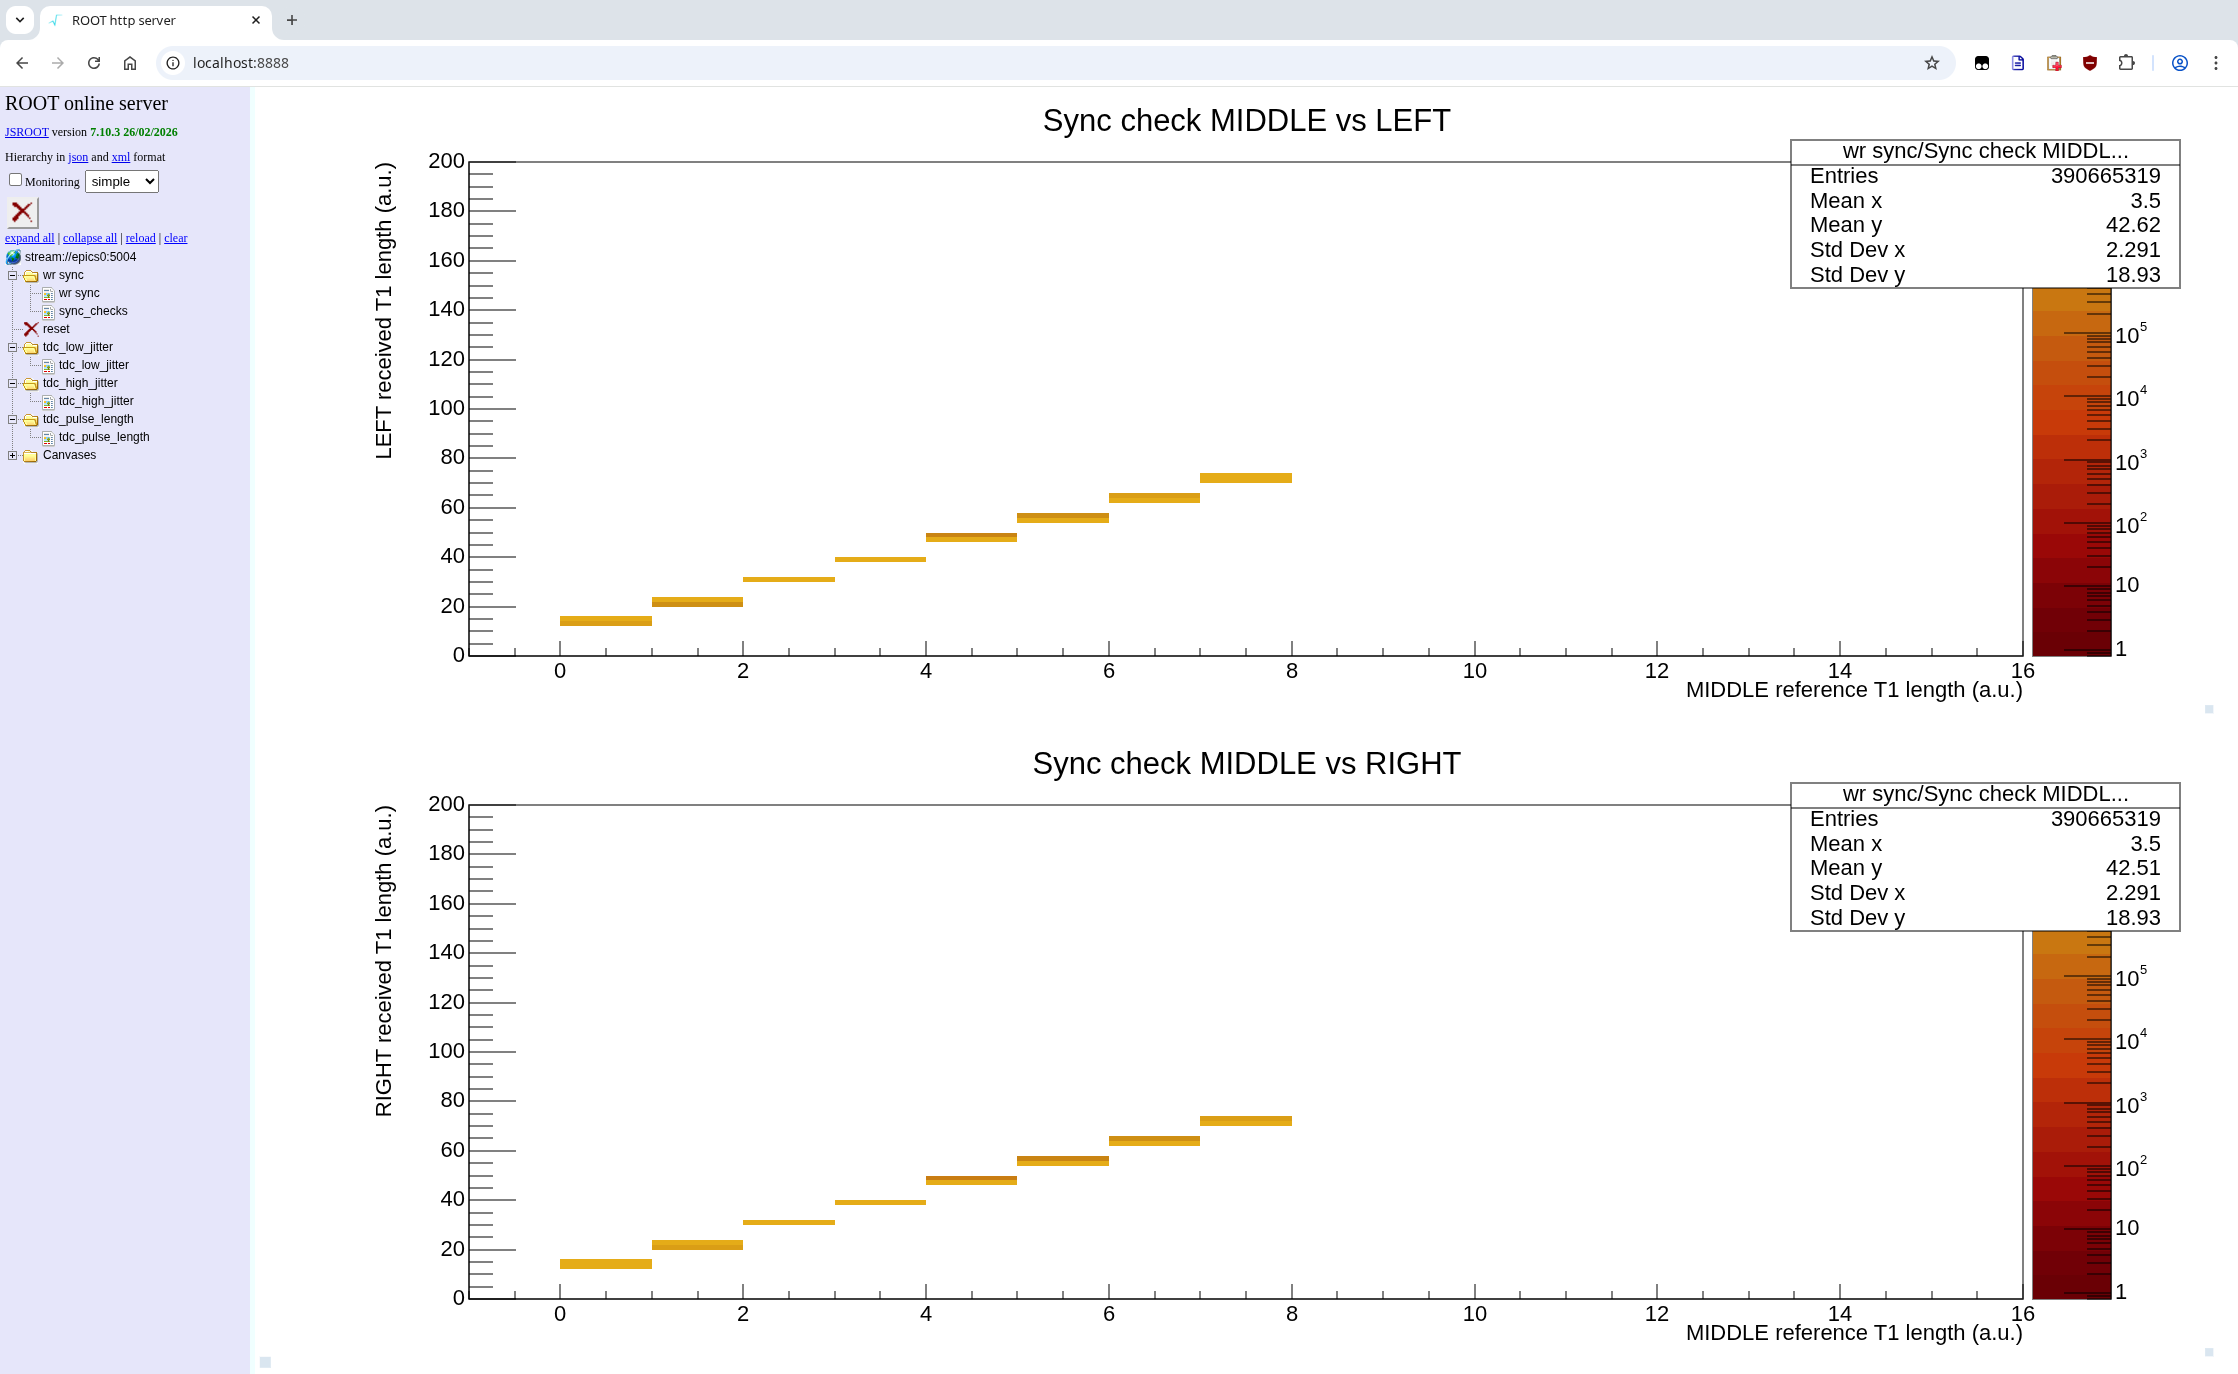
 sync checks
As sent and recorded by trloii. No surprises here.
sync checks
As sent and recorded by trloii. No surprises here.
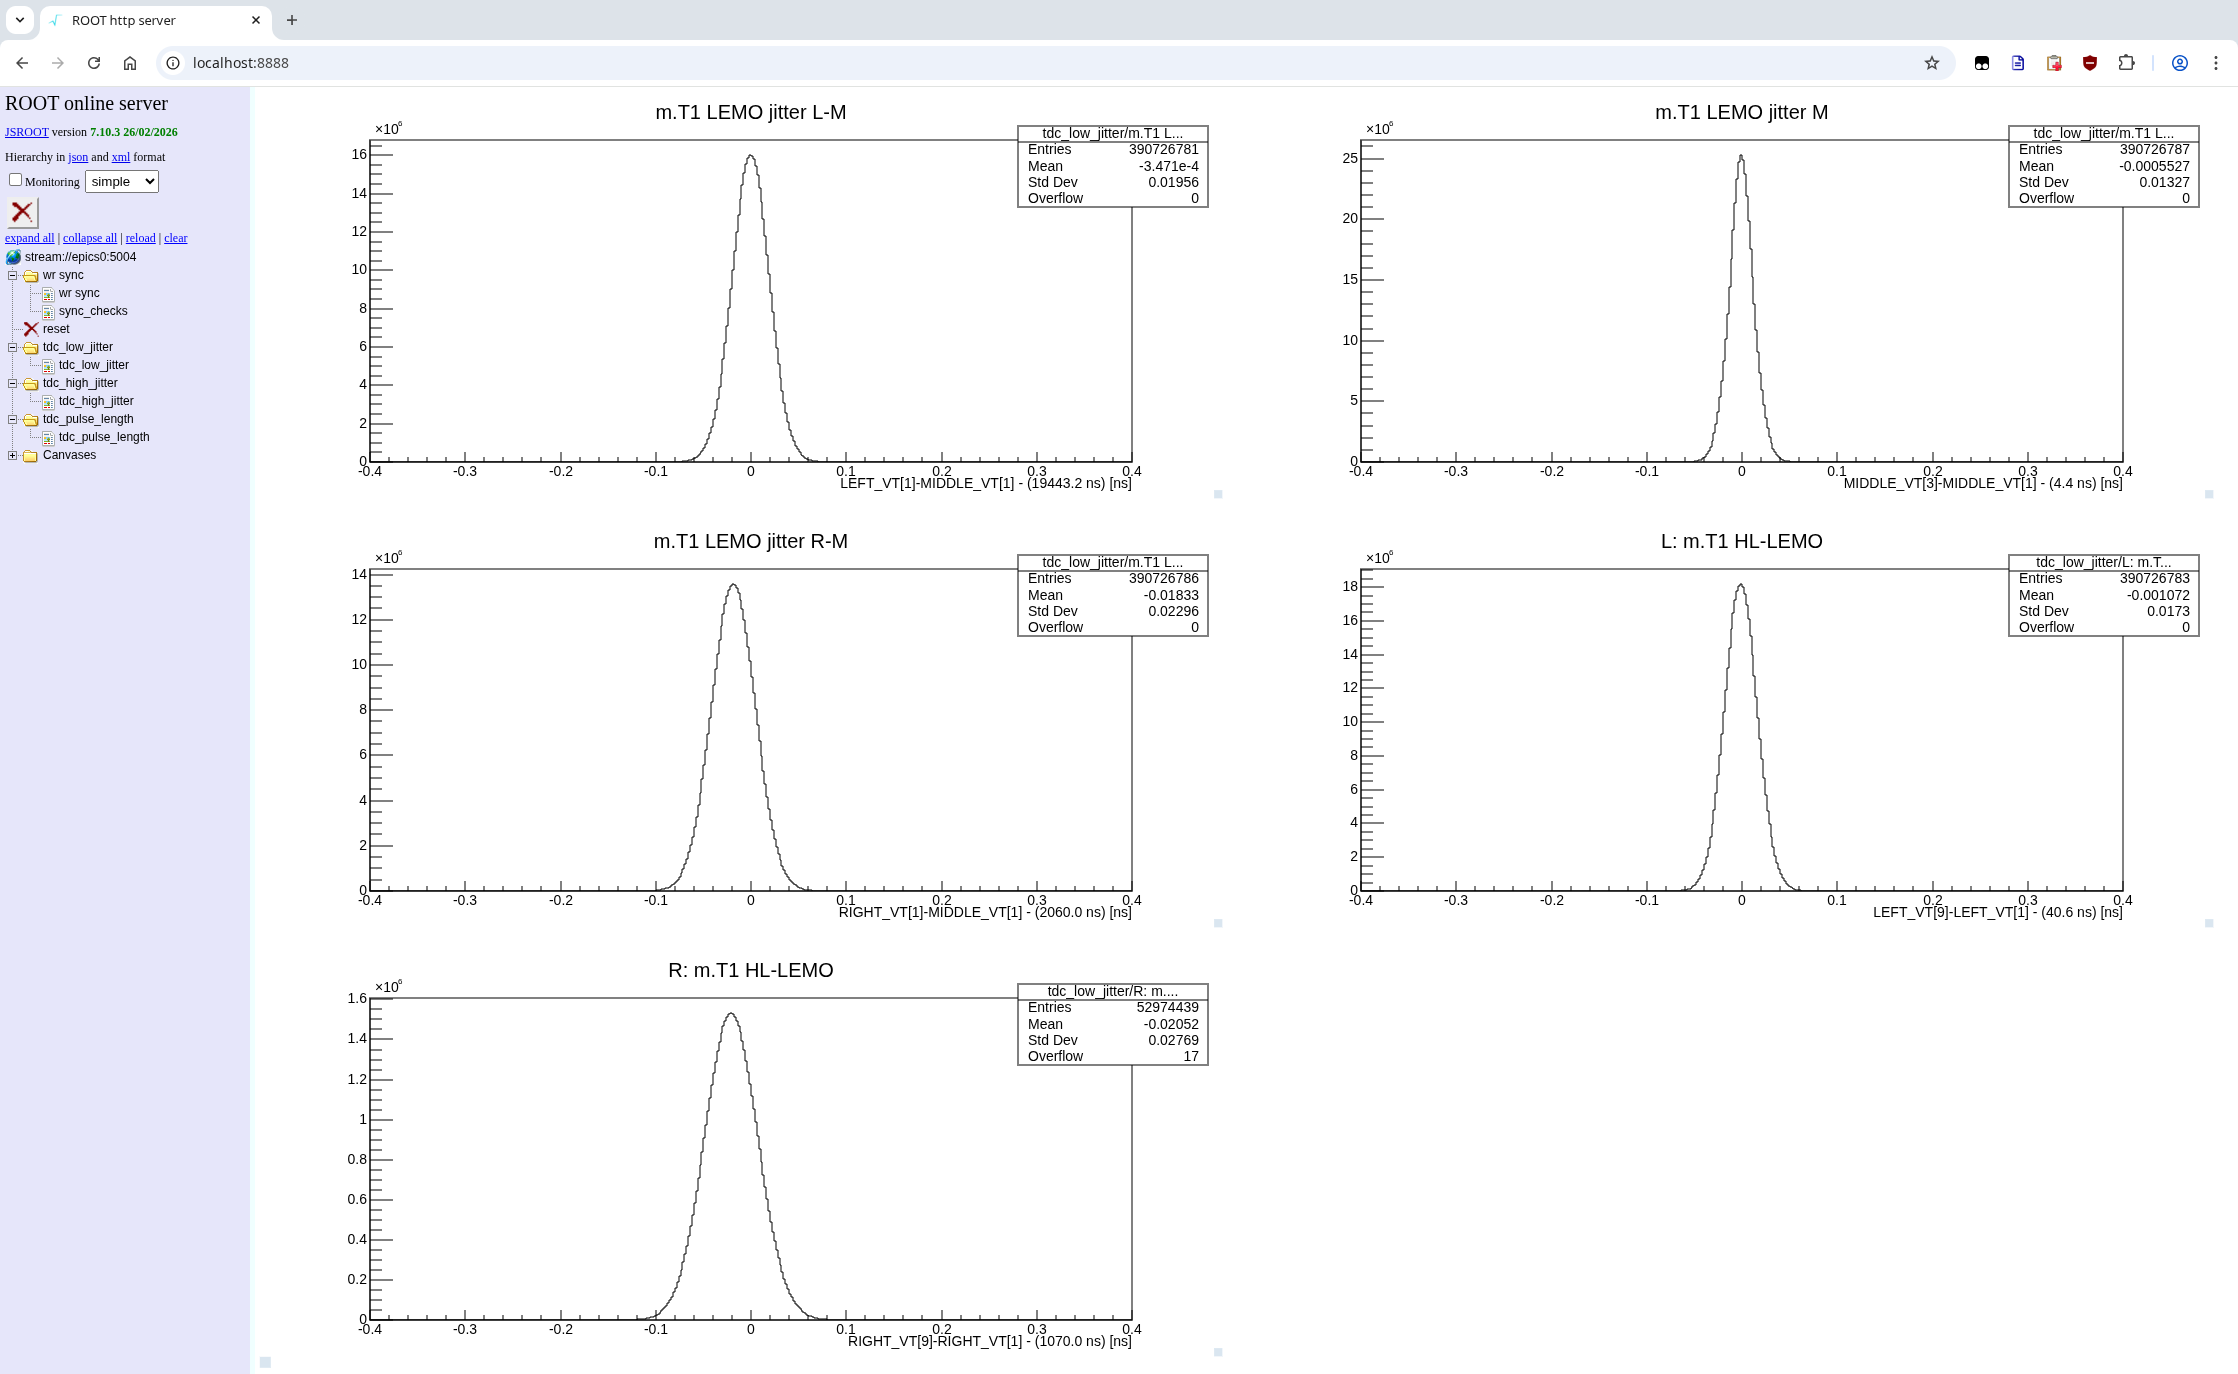
 tdc -- low range
In all of the TDC plots, we spend the first 1000 points after histogram clearing determining the average, then subtract this from the time difference.
That average is displayed as part of the x-axis label. Note that the right Highland was connected through a 200m MM fiber (hence 1us delay). Some drift was observed, and the signal stopped being detected at some point.
tdc -- low range
In all of the TDC plots, we spend the first 1000 points after histogram clearing determining the average, then subtract this from the time difference.
That average is displayed as part of the x-axis label. Note that the right Highland was connected through a 200m MM fiber (hence 1us delay). Some drift was observed, and the signal stopped being detected at some point.
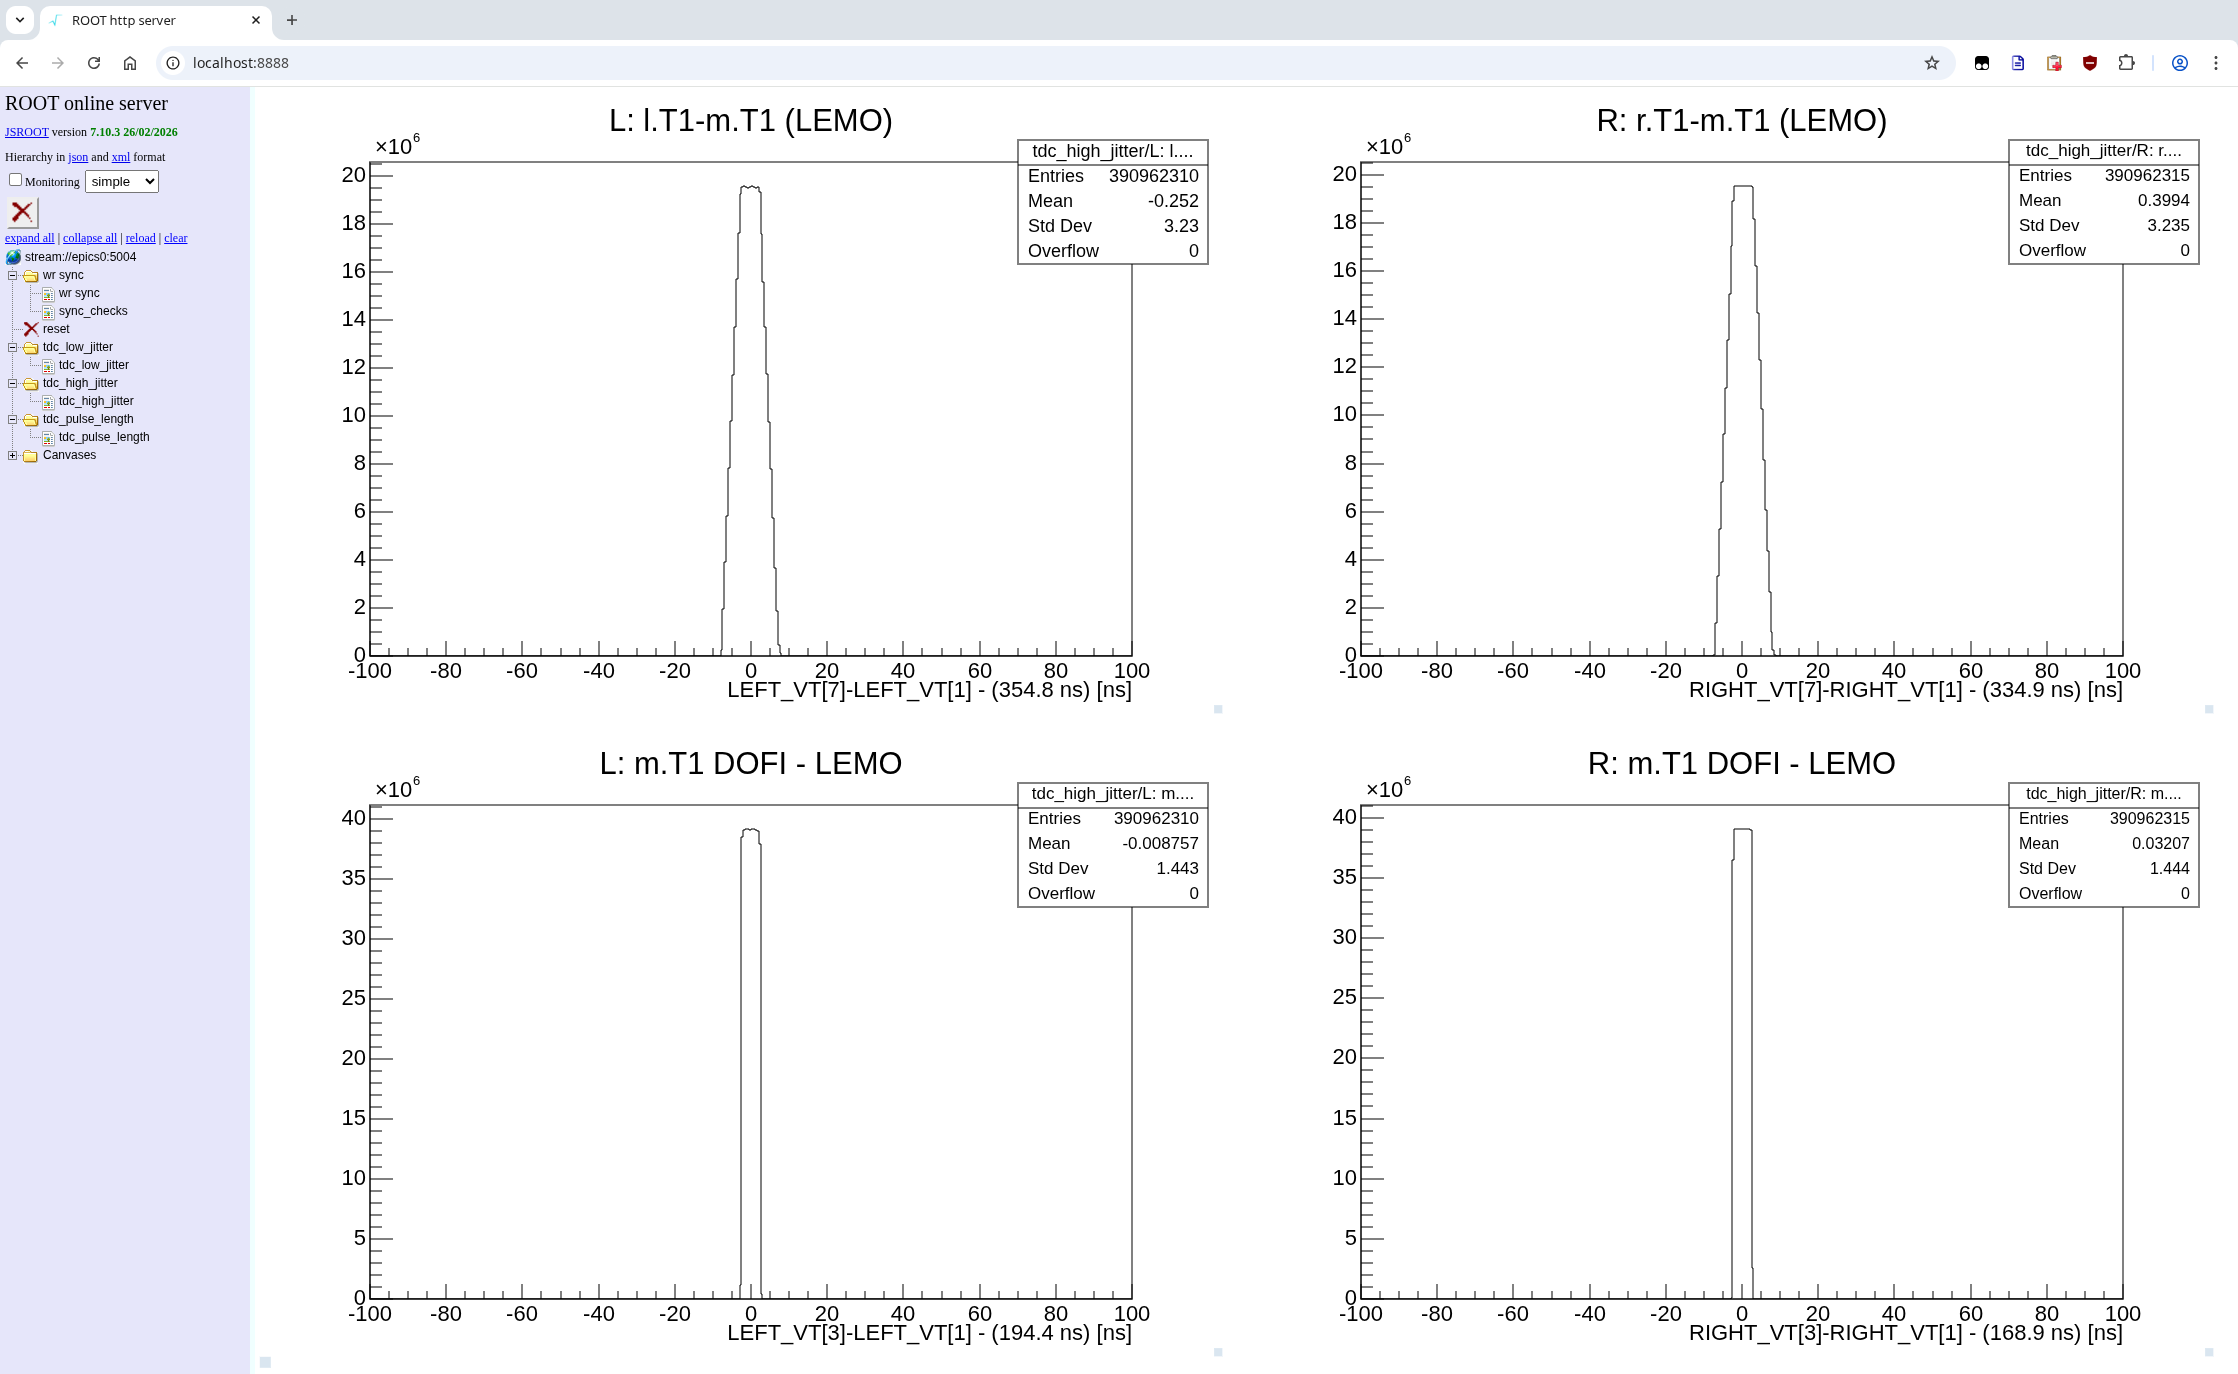
 tdc -- high range
The DOFI samples the data with 200MHz, giving a jitter of 5ns/sqrt(12)=1.44ns.
That signal is then sampled at 100MHz to create a local trigger in the VULOM. The sampling gives a resolution of 2.88ns, so in total we get a standard deviation of the time difference of 3.23ns.
tdc -- high range
The DOFI samples the data with 200MHz, giving a jitter of 5ns/sqrt(12)=1.44ns.
That signal is then sampled at 100MHz to create a local trigger in the VULOM. The sampling gives a resolution of 2.88ns, so in total we get a standard deviation of the time difference of 3.23ns.
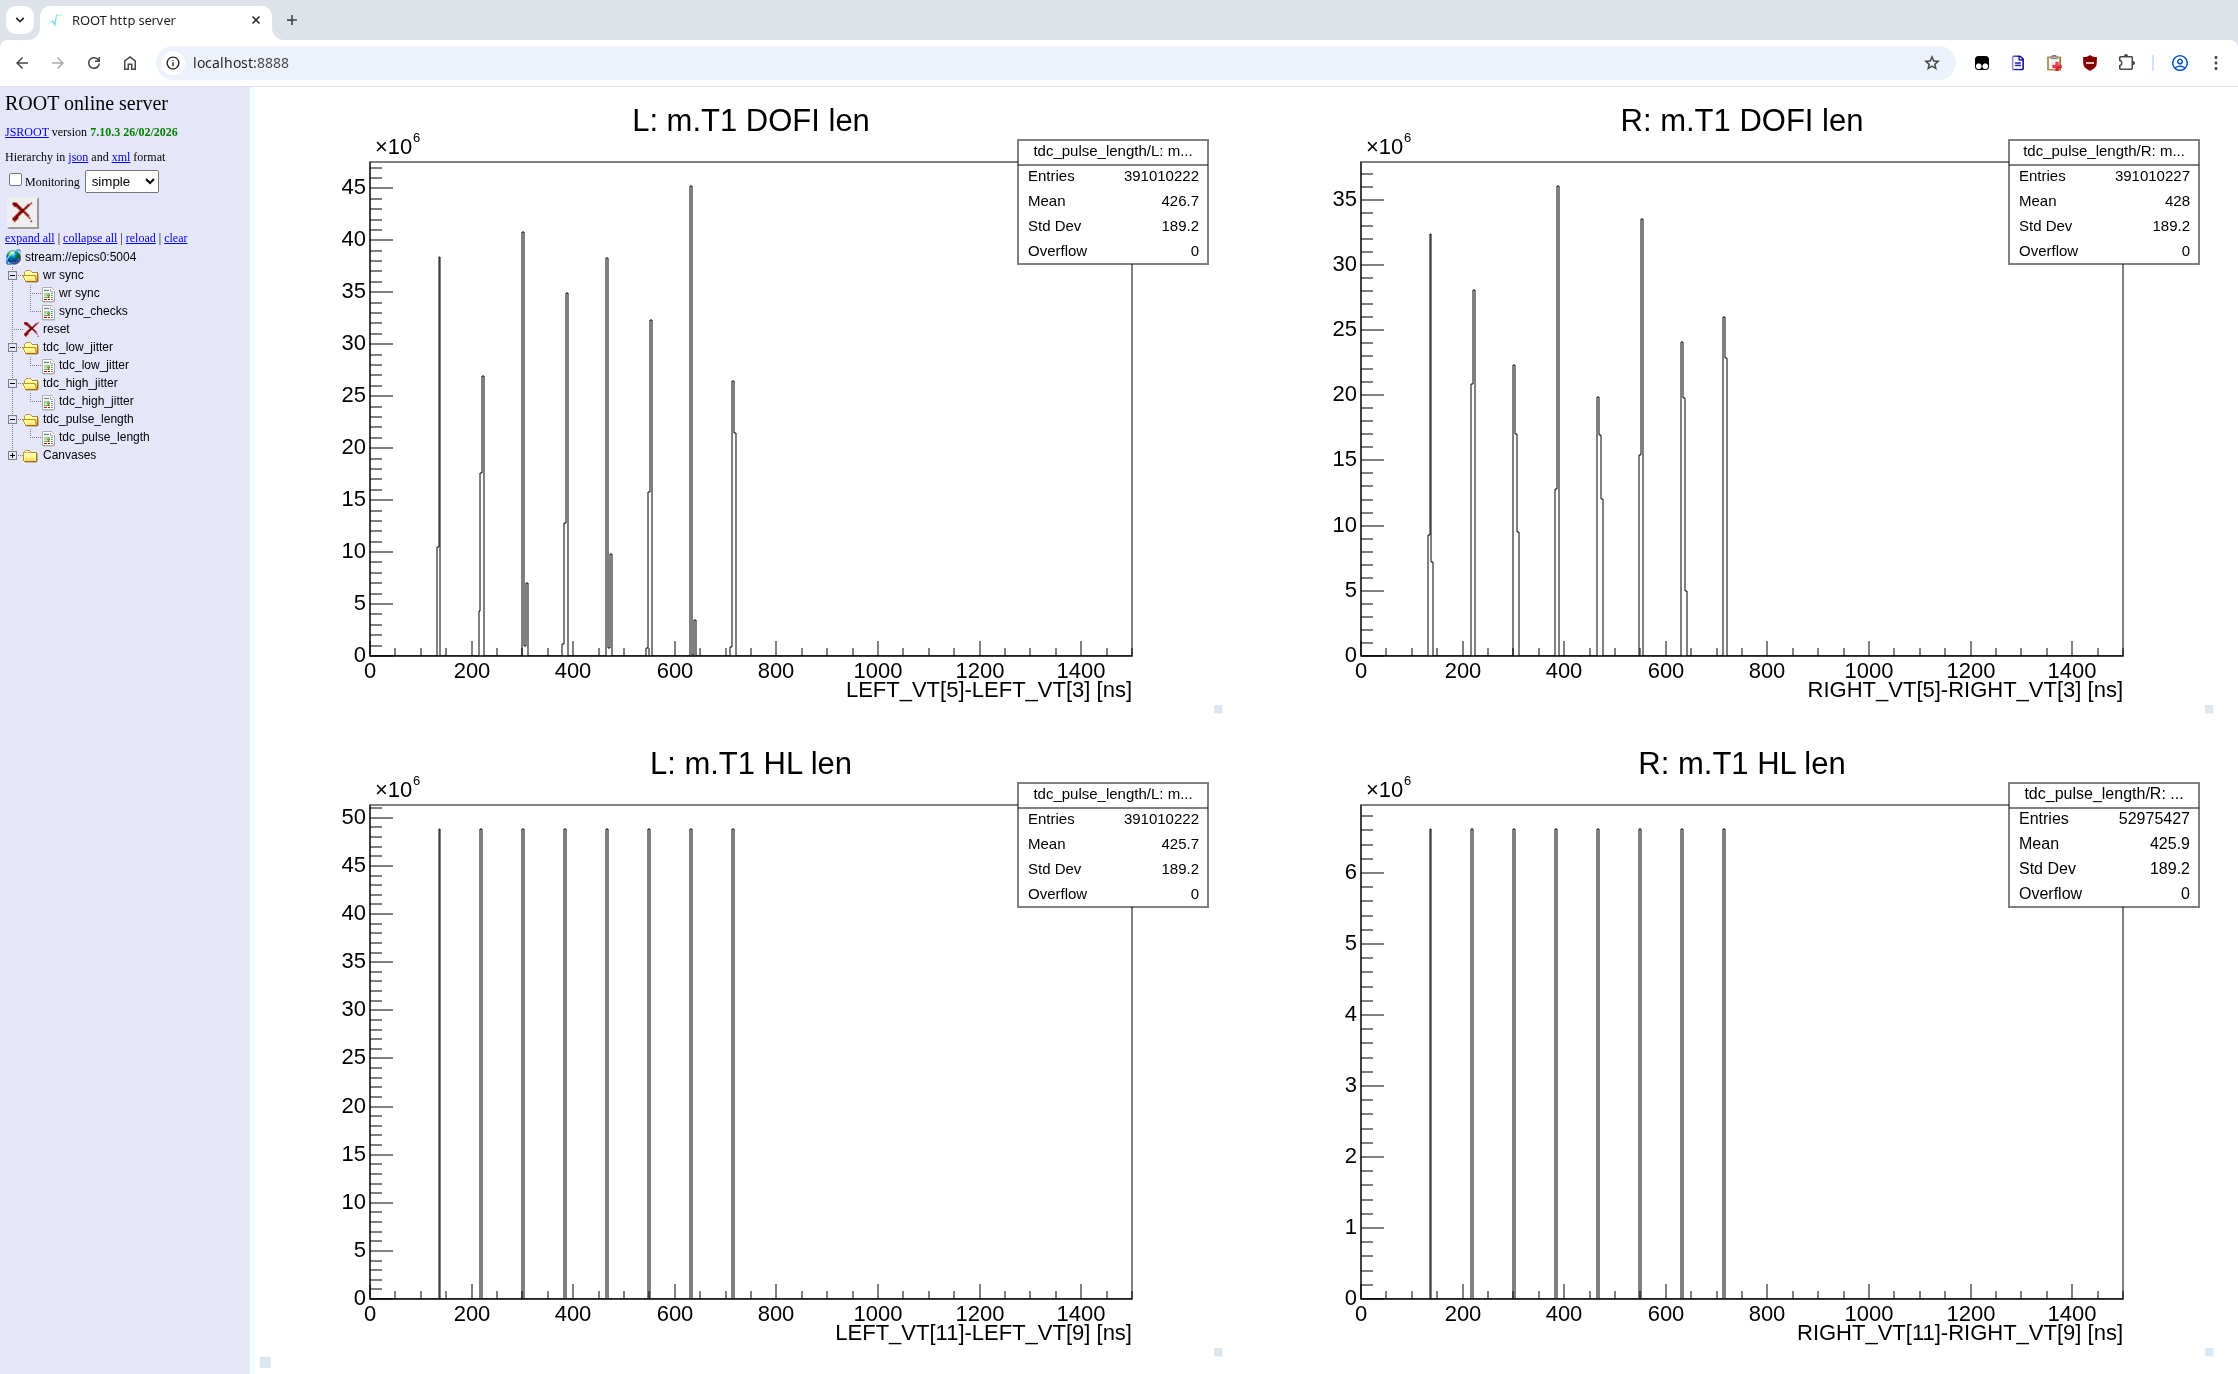
 tdc -- pulse length
The length of m.T1, measured for both fiber transmission systems. No average subtraction here.
The right Highland stopped working at some point. Curiously, the time difference between the signal lengths is about 577.5ns instead of 560ns as expected. Where would you even buy a quartz oscillator with a frequency instability of 30000ppm?
tdc -- pulse length
The length of m.T1, measured for both fiber transmission systems. No average subtraction here.
The right Highland stopped working at some point. Curiously, the time difference between the signal lengths is about 577.5ns instead of 560ns as expected. Where would you even buy a quartz oscillator with a frequency instability of 30000ppm?
 -- PhilippKlenze - 2026-05-23

| I | Attachment | Action | Size | Date | Who | Comment |
|---|---|---|---|---|---|---|
| |
pulse_length.png | manage | 141 K | 2026-05-23 - 23:48 | PhilippKlenze | |
| |
tdc_high.png | manage | 156 K | 2026-05-23 - 23:47 | PhilippKlenze | |
| |
tdc_low.png | manage | 141 K | 2026-05-23 - 23:46 | PhilippKlenze | |
| |
wr_overview.png | manage | 121 K | 2026-05-23 - 23:44 | PhilippKlenze | |
| |
wr_sync.png | manage | 165 K | 2026-05-23 - 23:45 | PhilippKlenze |
Please login to edit this topic
Topic revision: r4 - 2026-05-24, PhilippKlenze
Ideas, requests, problems regarding GSI Wiki? Send feedback | Legal notice | Privacy Policy (german)