|
|
You are here: GSI Wiki>NIUser Web>NIUserLabVIEW>TrendingWithHistogramm (2011-06-07, HolgerBrand)
Trending With Histogram.xctl
This XControl is a double indicator. It displays a running histogram of input data with sample size and a long term trending showing mean, standard deviation, minimum and maximum of that samples. Facade of the Trending With Histogram.xctl: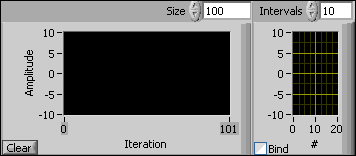 The sample size and histogram binning can be adjusted. The histogram y-scale can be bound to the trending scale.
-- HolgerBrand - 07 Jun 2011
The sample size and histogram binning can be adjusted. The histogram y-scale can be bound to the trending scale.
-- HolgerBrand - 07 Jun 2011
Please login to edit this topic
Topic revision: r1 - 2011-06-07, HolgerBrand
- User Reference
- BeginnersStartHere
- EditingShorthand
- Macros
- MacrosQuickReference
- FormattedSearch
- QuerySearch
- DocumentGraphics
- SkinBrowser
- InstalledPlugins
- Admin Maintenance
- Reference Manual
- AdminToolsCategory
- InterWikis
- ManagingWebs
- SiteTools
- DefaultPreferences
- WebPreferences
- Categories
Ideas, requests, problems regarding GSI Wiki? Send feedback | Legal notice | Privacy Policy (german)