You are here: GSI Wiki>TOS/BunchBucket Web>BunchBucketDocumentation>BunchBucketDocuments>BunchBucketTestsMeasurements>BunchBucketTestMeasurement13 (2023-09-01, dbeck)Edit Attach
June 2023: Testing Magnet Probe Signals at CRYRNG Extraction
Table of ContentsTL;DR
Actual kicks can be detected without problem. Getting precise timing on the rising edge of the signal is tricky and requires tuning.Introduction
At CRYRING, a detection of the magnet probe signals was not available in the 2022 beamtime. A new method dedicated to CRYRING has been implemented together with colleagues from RHV and EEL. The first test has been conducted on 22 June 2023 using the CRYRING extraction kicker (dry-beam). The main challenge has been to 'tap' the magnet probe signal to the digitizer without disturbing the shape of the signal at the digitizer input. The setup is described here.Measurements
Testing the kicker was done at the following settings- element hydrogen-like gold @ 4 MeV / u
- 511 kHz revolution frequency
- extraction kicker deflection between 1.5 ... 13 mrad
- 1.5 mrad correspond to about 1.6 kV at one power supply
- 13 mrad requires two power supplies at almost max voltage
Low Energy
Here, the kicker was operated at 2mrad, which corresponds to about 2.1kV at one power supply.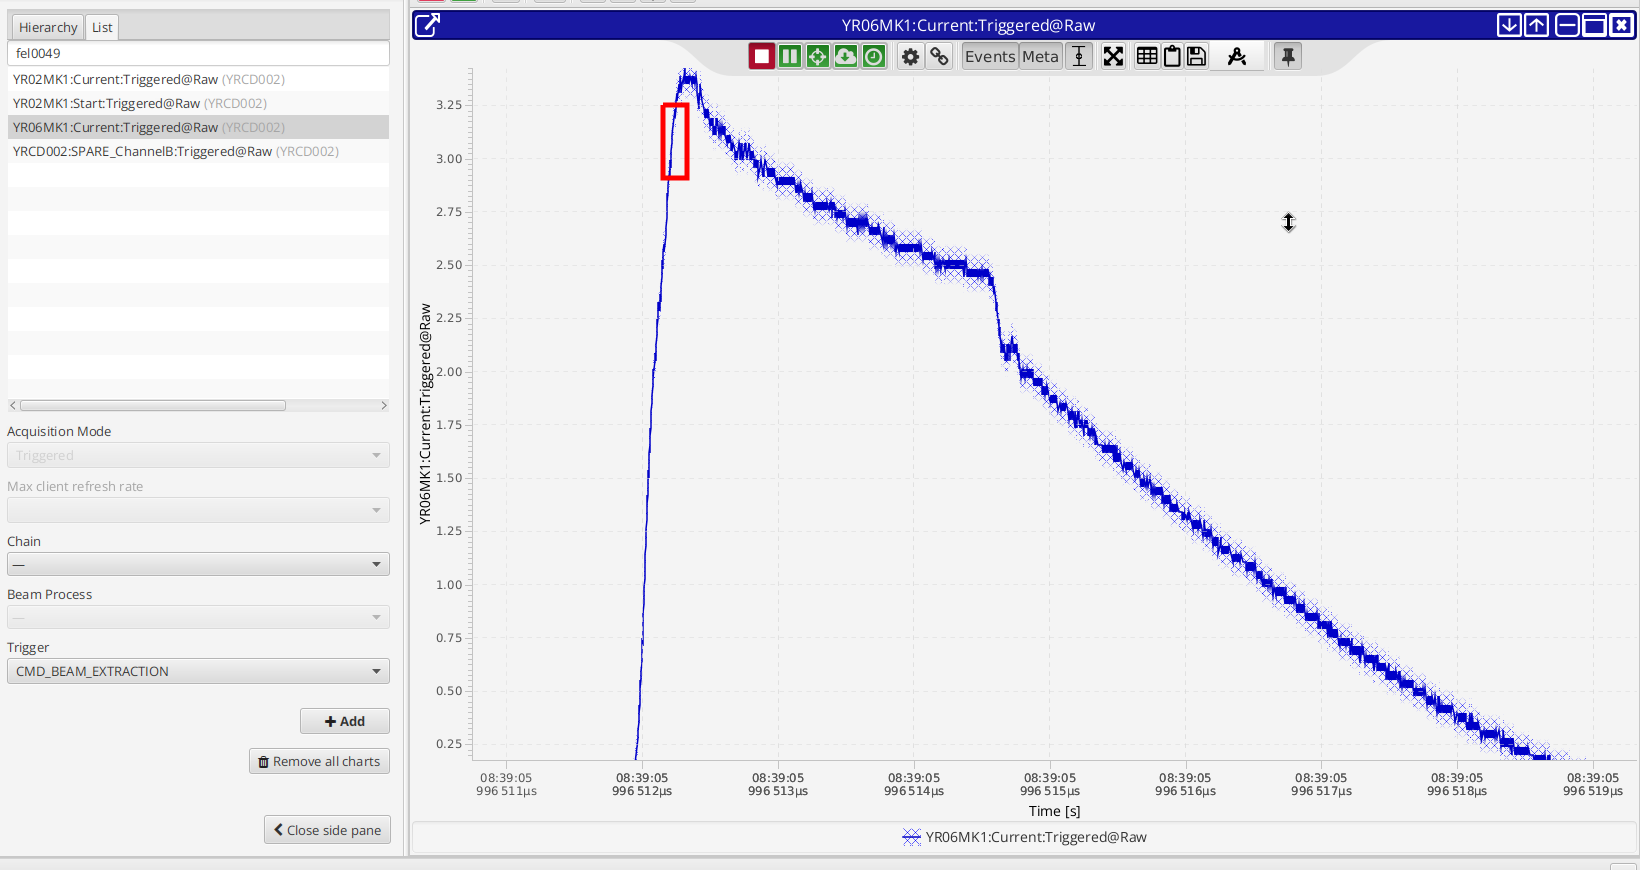 Figure: Signal of digitizer at low energy of extraction kicker. The red box indicates roughly the trigger level of the comparator.
The figure above shows the signal acquired by the digitizer. The figure below shows the data obtained by the b2b system.
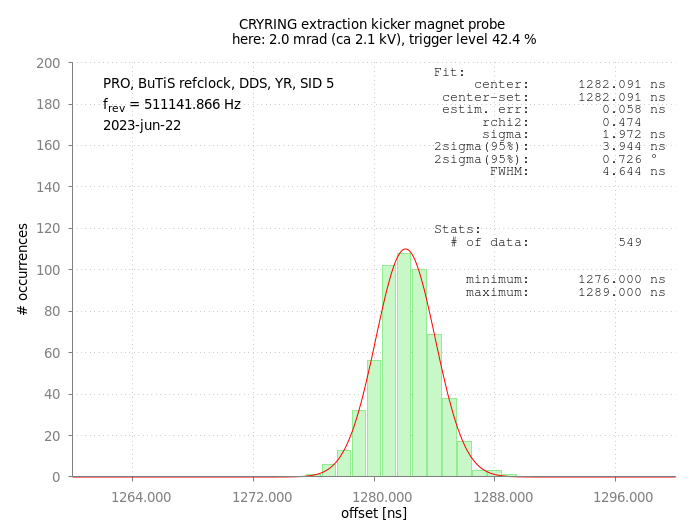 Figure: Histogram of 549 extractions at CRYRING. x-axis: offset from the b2b kicker-trigger event,y-axis: number of occurrences. Details see text.
It was possible to set the comparator level such, that magnet probe signals have been detected reliably. Surprisingly, this worked better than expected. The 2-sigma (95% CL) value is 4ns only and the window defined by the maximum outliers is 13 ns only. By comparing the mean value with the acquired data from the digitizer (and some math) is was confirmed, that the mean value of the measured distribution matches the rising edge of the kicker signal.
High Energy
Here, the kicker was operated at 12 mrad. Here, the power supply configuration at the kicker is a different one.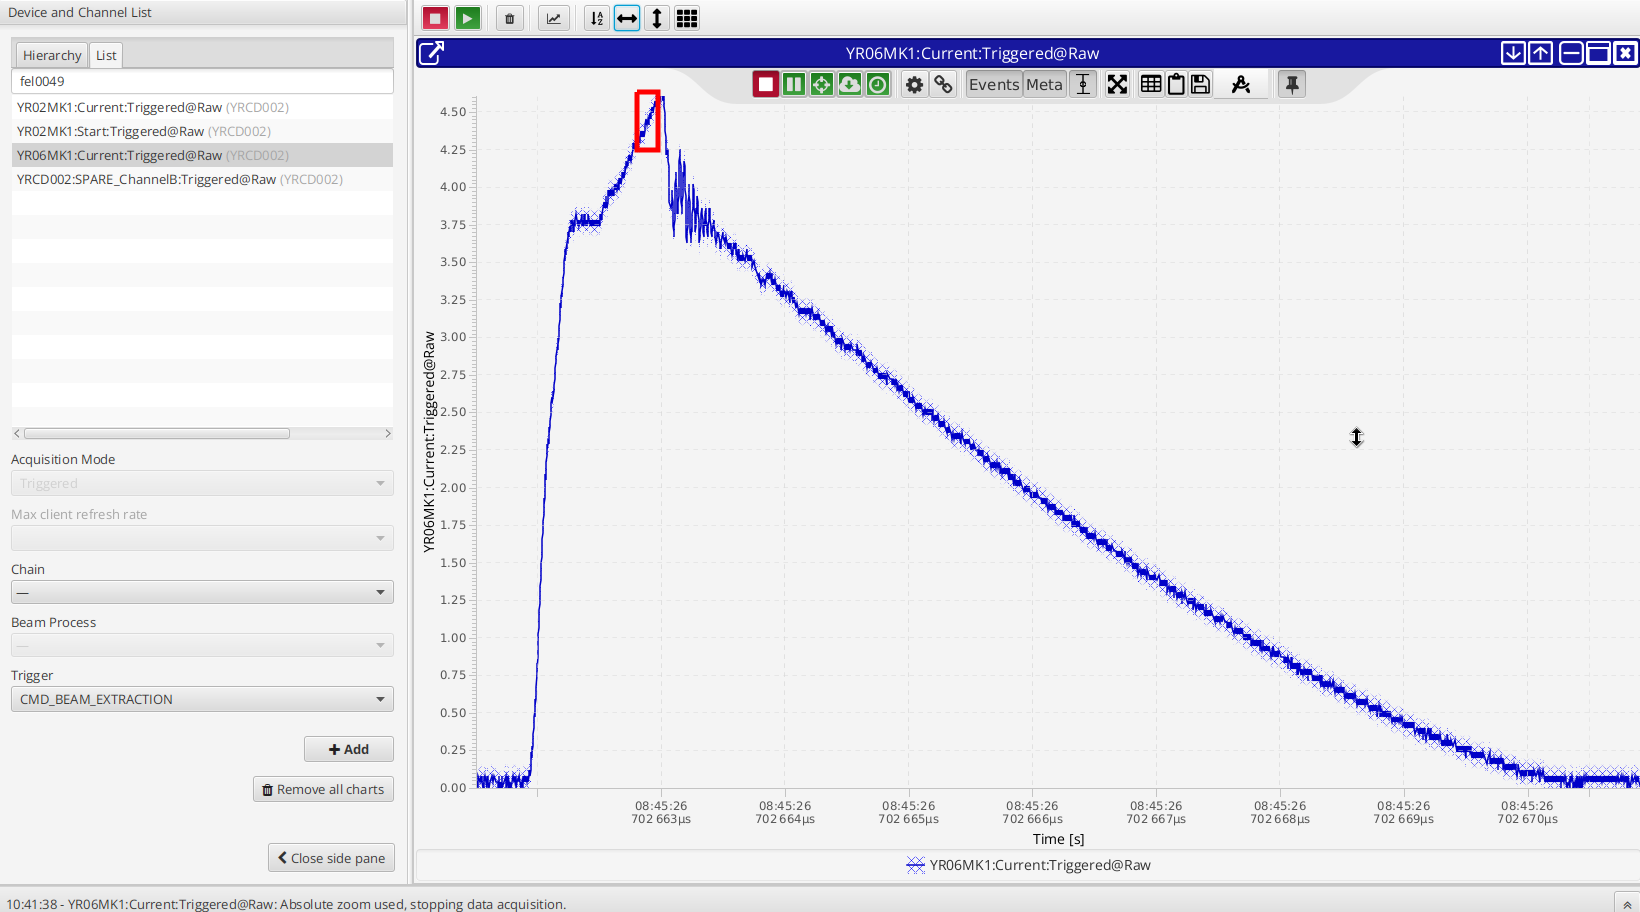 Figure: Signal of digitizer at high energy of extraction kicker. The red box indicates roughly the trigger level of the comparator (see text).
As with low-energy, the probe signal from the kicker was detected reliably. However, the distribution looks differently as shown in the figure below.
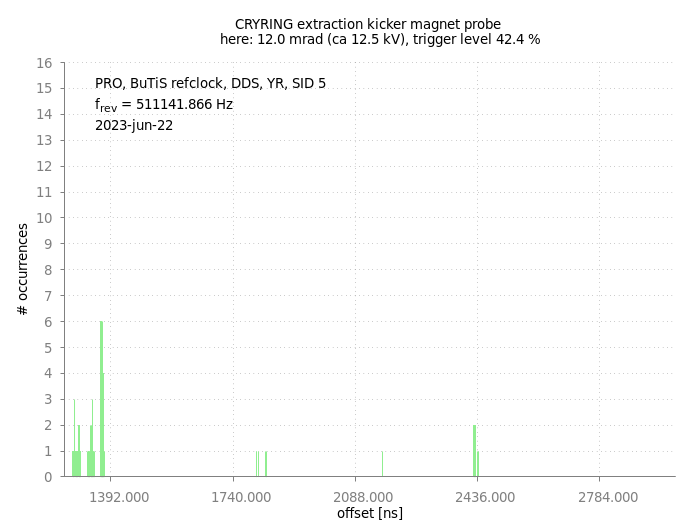
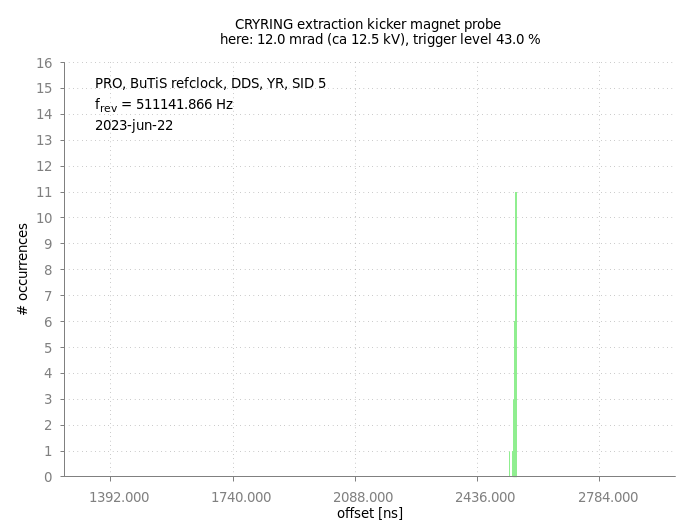 Figure: Histogram of detected magnet probe signals at CRYRING. x-axis: offset from the b2b kicker-trigger event, y-axis: number of occurrences. Top: Comparator is set to the same level used at low energy. Bottom: Comparator set to a higher level. Details see text.
Using the same comparator level as with low energy, the comparator 'fire' reliably, but not always in the same time; the observed distribution shown in the top figure might be caused by the 'ringing' shape of the tap signal. However, reliable measurements on the timing can be done with the level set to a higher value. This is shown in the lower figure. Here, a single narrow distribution with a center around 2445 ns (offset) is observed. This is about 1 microsecond later. When comparing with the acquired signal from the digitizer one finds, that the center of the histogram acquired by the b2b system does not correspond to the first rising edge, but to the maximum of the original probe signal (red box shown in the digitizer figure further above on this page).
Conclusion
The new setup implemented to detect the magnet probe signals at the CRYRING kicker has been tested at the extraction kicker for various energies. For all energies it is possible to detect the firing of the kicker reliably. For low energies, it is possible to adjust the comparator such, that the observed distribution is very small (FWHM ~ 5ns) and the center corresponds to the rising edge of the probe signal. For high energies, the situation is in fact more difficult. Although kicks are detected reliably, obtaining precise timing information requires to set the comparator to a different level: the position of the maximum signal can be determined, but not the position of the first rising edge. -- DietrichBeck - 23 Jun 2023| I | Attachment | Action | Size | Date | Who | Comment |
|---|---|---|---|---|---|---|
| |
b2b-yr-extraction_probe-12mrad-a.png | manage | 30 K | 2023-06-23 - 14:49 | UnknownUser | signal detected by the b2b system |
| |
b2b-yr-extraction_probe-12mrad-b.png | manage | 30 K | 2023-06-23 - 14:49 | UnknownUser | signal detected by the <nop>b2b system |
| |
b2b-yr-extraction_probe-12mrad-digitizer-b.png | manage | 186 K | 2023-06-23 - 14:46 | UnknownUser | digitizer signal at about 12mrad |
| |
b2b-yr-extraction_probe-2mrad-digitizer-b.png | manage | 169 K | 2023-06-23 - 14:28 | UnknownUser | digitizer signal at about 2mrad |
| |
b2b-yr-extraction_probe-2mrad.png | manage | 51 K | 2023-06-23 - 14:36 | UnknownUser | signal detected by the <nop>b2b system |
Edit | Attach | Print version | History: r3 < r2 < r1 | Backlinks | View wiki text | Edit wiki text | More topic actions
Topic revision: r3 - 2023-09-01, dbeck
 Copyright © by the contributing authors. All material on this collaboration platform is the property of the contributing authors.
 Ideas, requests, problems regarding GSI Wiki? Send feedback | Legal notice | Privacy Policy (german)


