You are here: GSI Wiki>TOS/BunchBucket Web>BunchBucketDocumentation>BunchBucketDocuments>BunchBucketTestsMeasurements>BunchBucketTestMeasurement1 (2020-11-27, dbeck)Edit Attach
June 2019: Frequency Beating on Office Desk
Table of ContentsSetup
In June 2019, first measurements have been done using the following setup in my office- two 'DDS h=1 signals' generated using the clock generator of a timing receiver (pexaria, saft-clk-gen)
- two timing receivers for phase measurements (pexaria, lm32 firmware); one TR per signal
- one timing receiver as cbu (standalone, lm32 firwmare)
- one timine reciever for generating a 'synch signal' (pexaria, config via 'saft tools')
- https://github.com/GSI-CS-CO/bel_projects
- branch b2b-test_dietrich_2019-05-20
- commit c8e1774
- /modules/b2b-test/
- extraction: h = 1 clock 2000001 Hz, harmonic number 3
- injection h = 1 clock 3000011 Hz, harmonic number 2
- bunch (bucket) frequency ~6000000 Hz, beat frequency 9 Hz
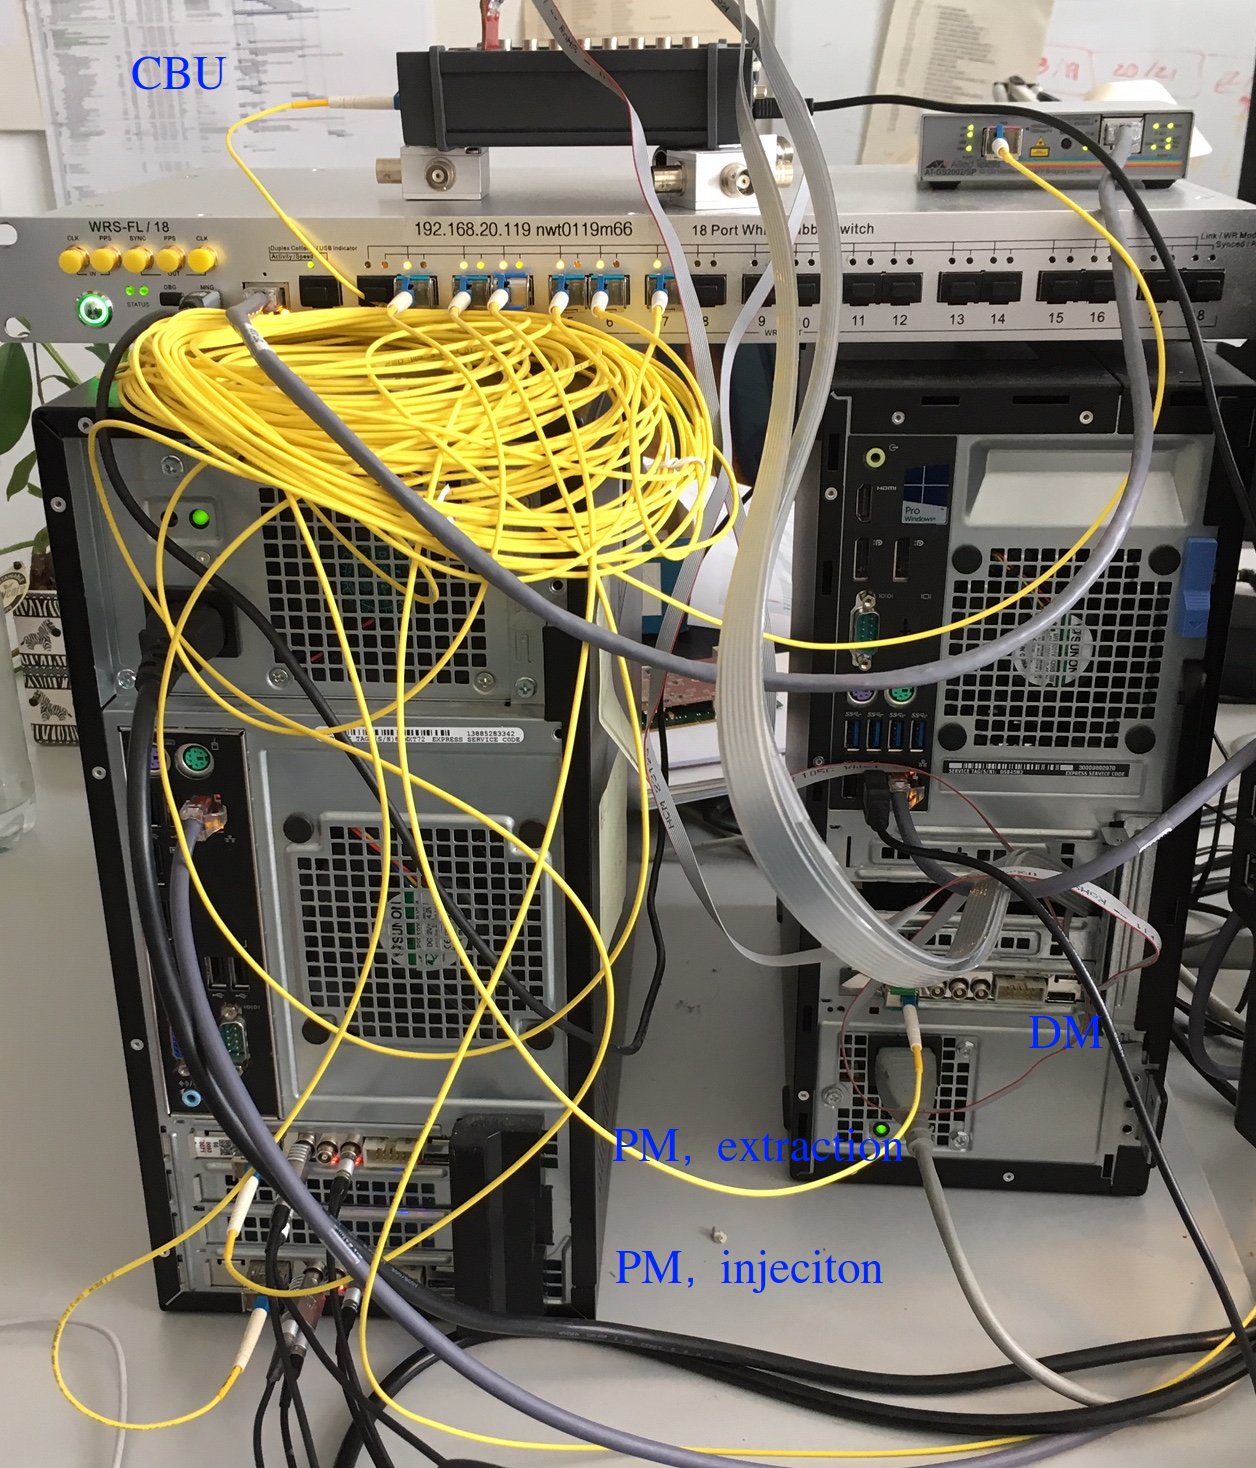
 Figure: Setup of the test setup. Two TRs serve for phase measurement of clock signals, each connected at the left most connector with 'Lemo Y' (left PC; top: extraction, bottom: injection). The DM controlling the measurement is integrated into the right PC. Another TR in a third PC serves for generating the two h = 1 signals (not shown). The standalone TR serving as CBU is positioned on top. All five WR nodes are connected using a White Rabbit switch (top).
The figure above gives an overview on the simple setup. It contains of four Timing Receivers (2 phase measurement, 1 CBU, 1 DDS (2 signals)) and one Data Master. All nodes are synchronized using White Rabbit. The TRs used for phase measurement also generate additional signals on the right most connector 'CMD_B2B_START' (top) and 'CMD_B2B_DIAGMATCH' (bottom).
Measurements
Summary
To summarize: Using the beating method and a Timing Receiver based phase measurement, a synchronization of the h=1 signals in the order of 1ns can actually be achieved. -- DietrichBeck - 27 Nov 2020| I | Attachment | Action | Size | Date | Who | Comment |
|---|---|---|---|---|---|---|
| |
b2b-meas1.JPG | manage | 787 K | 2019-06-11 - 14:16 | UnknownUser | b2b measurement, overview |
| |
b2b-meas2.JPG | manage | 658 K | 2019-06-11 - 13:32 | UnknownUser | b2b measurement, phase at start |
| |
b2b-meas3.JPG | manage | 667 K | 2019-06-11 - 13:33 | UnknownUser | b2b measurement, phase at end |
| |
b2b-meas4.JPG | manage | 850 K | 2019-06-11 - 15:51 | UnknownUser | b2b measurement, phase at start magnified |
| |
setup_sommer2019b.jpg | manage | 406 K | 2019-06-11 - 13:57 | UnknownUser | b2b measurement, setup |
Edit | Attach | Print version | History: r2 < r1 | Backlinks | View wiki text | Edit wiki text | More topic actions
Topic revision: r2 - 2020-11-27, dbeck
 Copyright © by the contributing authors. All material on this collaboration platform is the property of the contributing authors.
 Ideas, requests, problems regarding GSI Wiki? Send feedback | Legal notice | Privacy Policy (german)


