|
|
You are here: GSI Wiki>TOS/BunchBucket Web>BunchBucketDocumentation>BunchBucketDocuments>BunchBucketTestsMeasurements>BunchBucketTestMeasurement18 (2025-04-28, DietrichBeck)
February 2025: Phase Shift in the Integration System
Table of ContentsProcedure
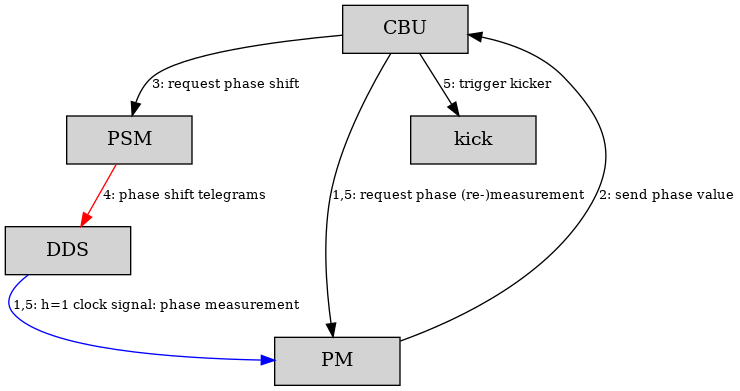
Figure: Schematic view of data flow. Boxes are hardware modules, each an FPGA connected to the White Rabbit network with a host system added: Central B2B Unit (CBU), Phase Shift Module (PSM), Direct Digital Synthesis (DDS), Phase Measurement (PM) and Kicker Trigger (kick). Arrows indicate data flow. Black: timing messages sent via the White Rabbit network as broadcast. Red: phase shift telegrams via dedicated optical link. Blue: two different phase measurements of one clock output of the same DDS. Data flow for monitoring and diagnostic is not shown. The procedure shown in the figure above is the one for fast extraction. The CBU requests a phase measurement from the PM. The PM measures the phase (rising edges of the DDS clock output). The result is a timestamp with picoseconds precision that is sent back to the CBU. Using the known frequency the CBU calculates the deadline (time) at which the kicker shall be fired. This time into account configured offsets, phase shift value and phase shift duration. The CBU requests the phase shift at the PSM and sends out the timing messages triggering the kicker. The PSM shifts the phase at the DDS by sending telegrams via optical links. The CBU sends a timing message requesting to trigger the kicker at the proper time (and rf-phase). The PM receives the kicker trigger message and re-measures the DDS phase at the moment the kicker is fired
Integration System: Measuring the Phase Shift Curve using the B2B System.
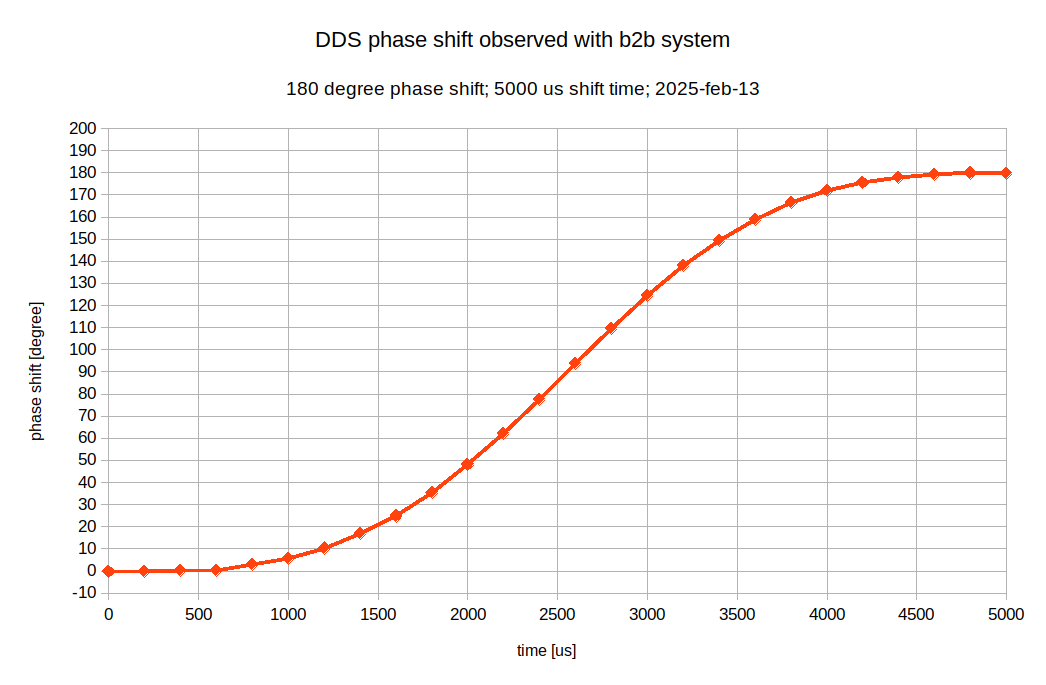 Figure: Observation of 180 degree phase shift at SIS18 (integration system). Shift time is 5 ms.
The figure above shows the phase difference of the h=1 DDS while the phase shift module is shifting the phase of the DDS. The measurement was done on the SIS18 extraction flat at a revolution (DDS, h=1) frequency of 785 kHz.
Here, the bunch-2-bucket system is used to re-measure the phase of the h=1 DDS every 200 us after the phase shift starts. This measurement just verifies that the PSM and DDS are operating as expected. A closer look shows, that the curve is slightly smeared out to the right: As an example, the phase shift of 90 degree is not observed at precisely 2500 us but a little bit later. This can be explained, as each phase measurement with the bunch-2-bucket system takes some time. This delay is not taken into account in the analysis. Thus, the measured phase differences 'appear' a bit later. This is not relevant for normal operation, as the phase measurement is only done when DDS phase and frequency are expected to be constant.
-- DietrichBeck - 2025-04-23
Figure: Observation of 180 degree phase shift at SIS18 (integration system). Shift time is 5 ms.
The figure above shows the phase difference of the h=1 DDS while the phase shift module is shifting the phase of the DDS. The measurement was done on the SIS18 extraction flat at a revolution (DDS, h=1) frequency of 785 kHz.
Here, the bunch-2-bucket system is used to re-measure the phase of the h=1 DDS every 200 us after the phase shift starts. This measurement just verifies that the PSM and DDS are operating as expected. A closer look shows, that the curve is slightly smeared out to the right: As an example, the phase shift of 90 degree is not observed at precisely 2500 us but a little bit later. This can be explained, as each phase measurement with the bunch-2-bucket system takes some time. This delay is not taken into account in the analysis. Thus, the measured phase differences 'appear' a bit later. This is not relevant for normal operation, as the phase measurement is only done when DDS phase and frequency are expected to be constant.
-- DietrichBeck - 2025-04-23 

| I |
Attachment | Action | Size | Date | Who | Comment |
|---|---|---|---|---|---|---|
| |
2025-02-13_phase_shift_measurement_b2ext-pshift.png | manage | 45 K | 2025-04-23 - 16:53 | DietrichBeck | phase shift at SIS18 (integration system) |
Please login to edit this topic
Topic revision: r6 - 2025-04-28, DietrichBeck
Ideas, requests, problems regarding GSI Wiki? Send feedback | Legal notice | Privacy Policy (german)